Example Simulations
Flu at Allegheny County Schools
Suppose you want to investigate the impact an infectious disease (such as the flu) may have on two specific types of schools: Those with predominantly low-income students and those with few low-income students. Specifically, you want to know if an epidemic outbreak is more likely at either of them. In this section, we briefly examine a simulation that helps to answer this question. PRAMs can be employed in any domain; this is just an example of how the present package can be used.
This simulation takes the synthetic population of 200,169 students in the Allegheny County, uses it to automatically generate entities (i.e., groups and sites), and apply two hand-forged rules in a 100-iteration PRAM. The resulting groups cumulatively model functionally equivalent agents and the resulting sites encode locations these agents can be at (here, home or school). The two rules define ways in which an agent’s flu status affect its behavior and are the source of the dynamics of the simulation.
The simulation results below have been generated by the res.py script and are based on the data collected by the sim-03-flu-allegheny.py script (which also contains the rules code).
The Two Schools Separately
Below are time series of the probability of being in one of the three mutually exclusive and exhaustive flu states: Susceptible, exposed, and recovered. The first plot shows the time series for the low-income school and is followed by a plot for the medium-income school. It is obvious that the time series evolve differently at the two locations and the next subsection compares these locations side-by-side.
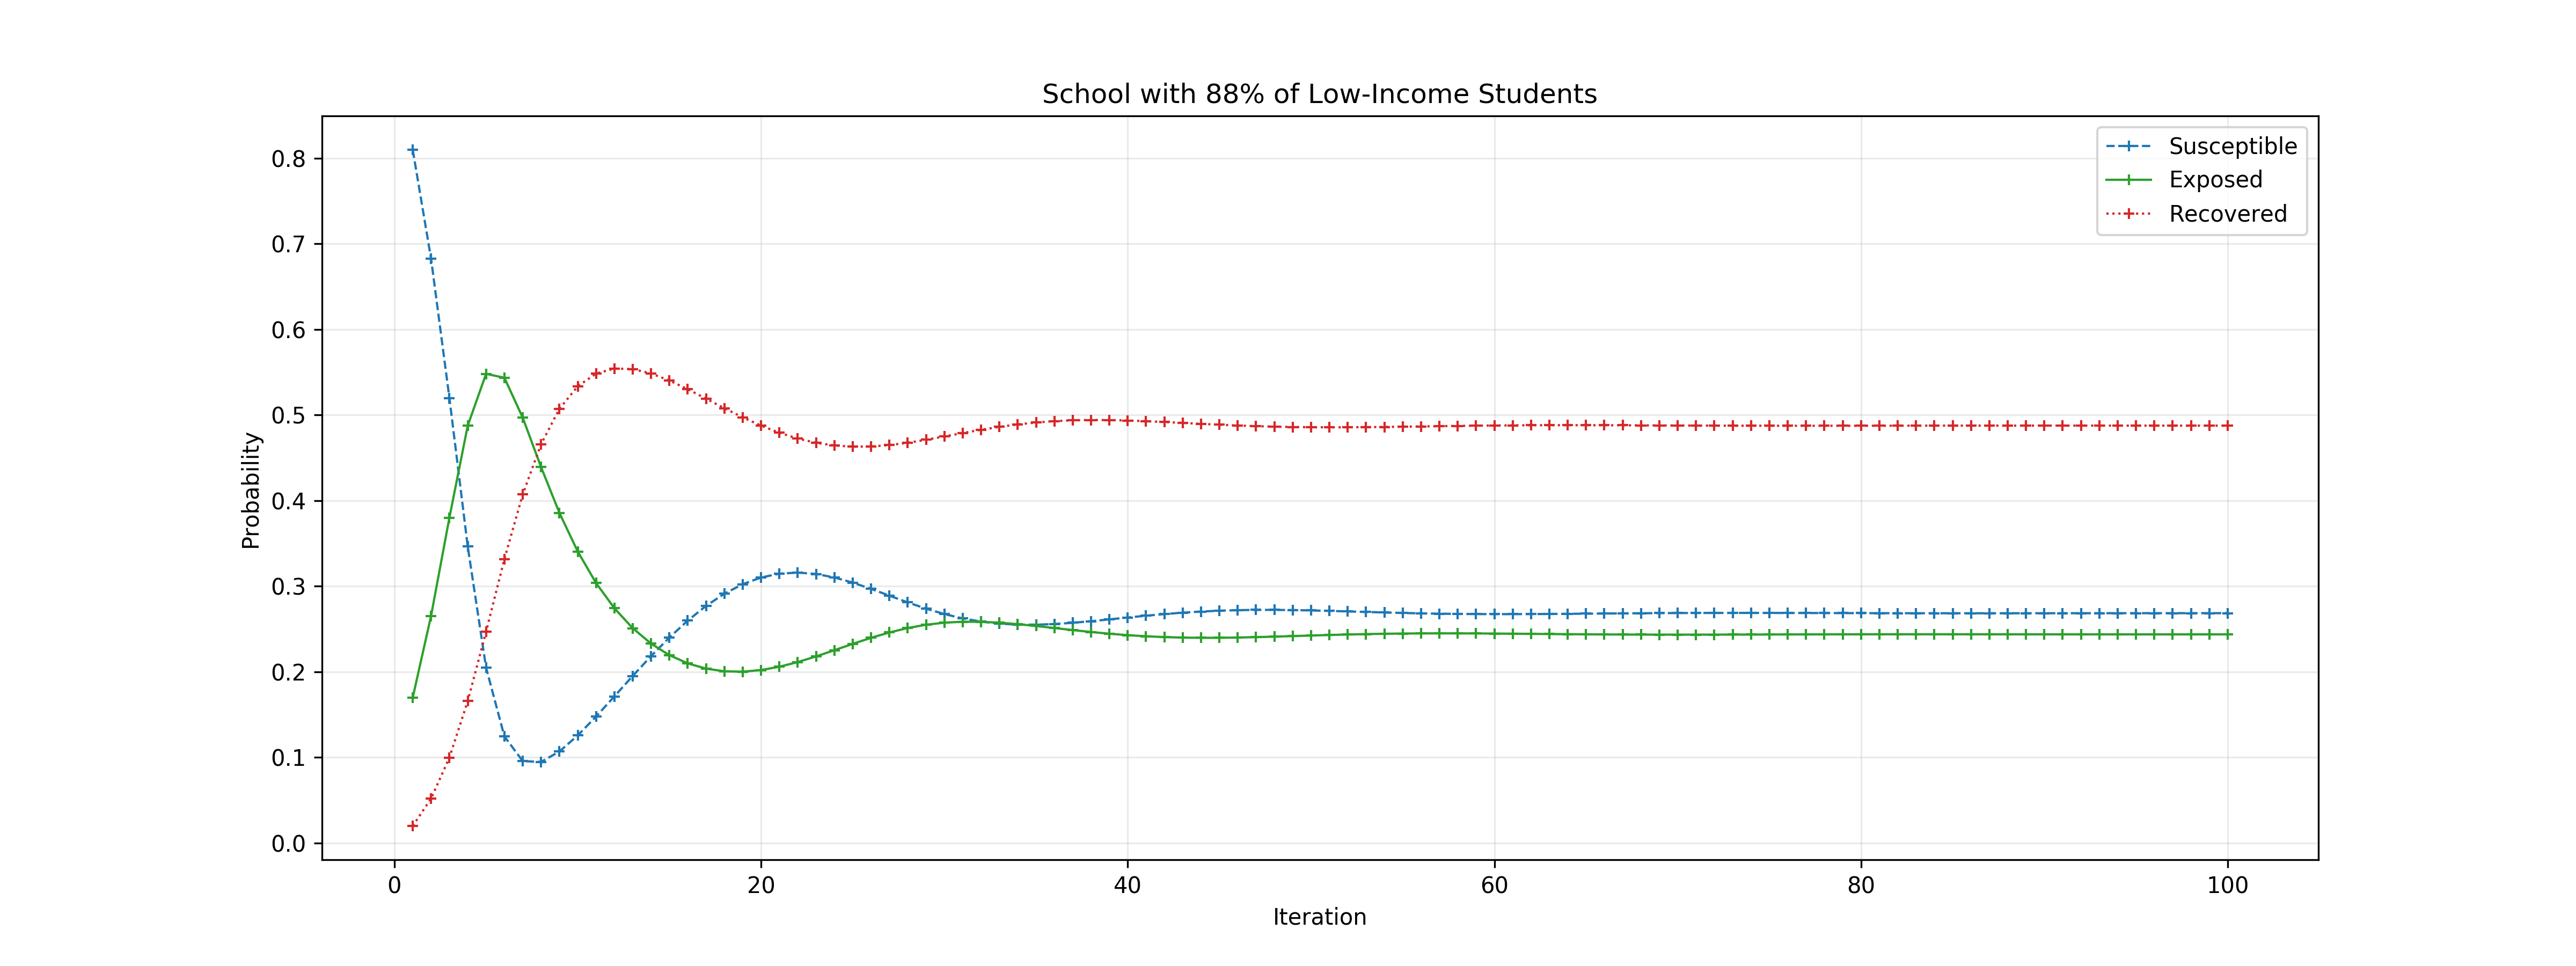
Low-income school
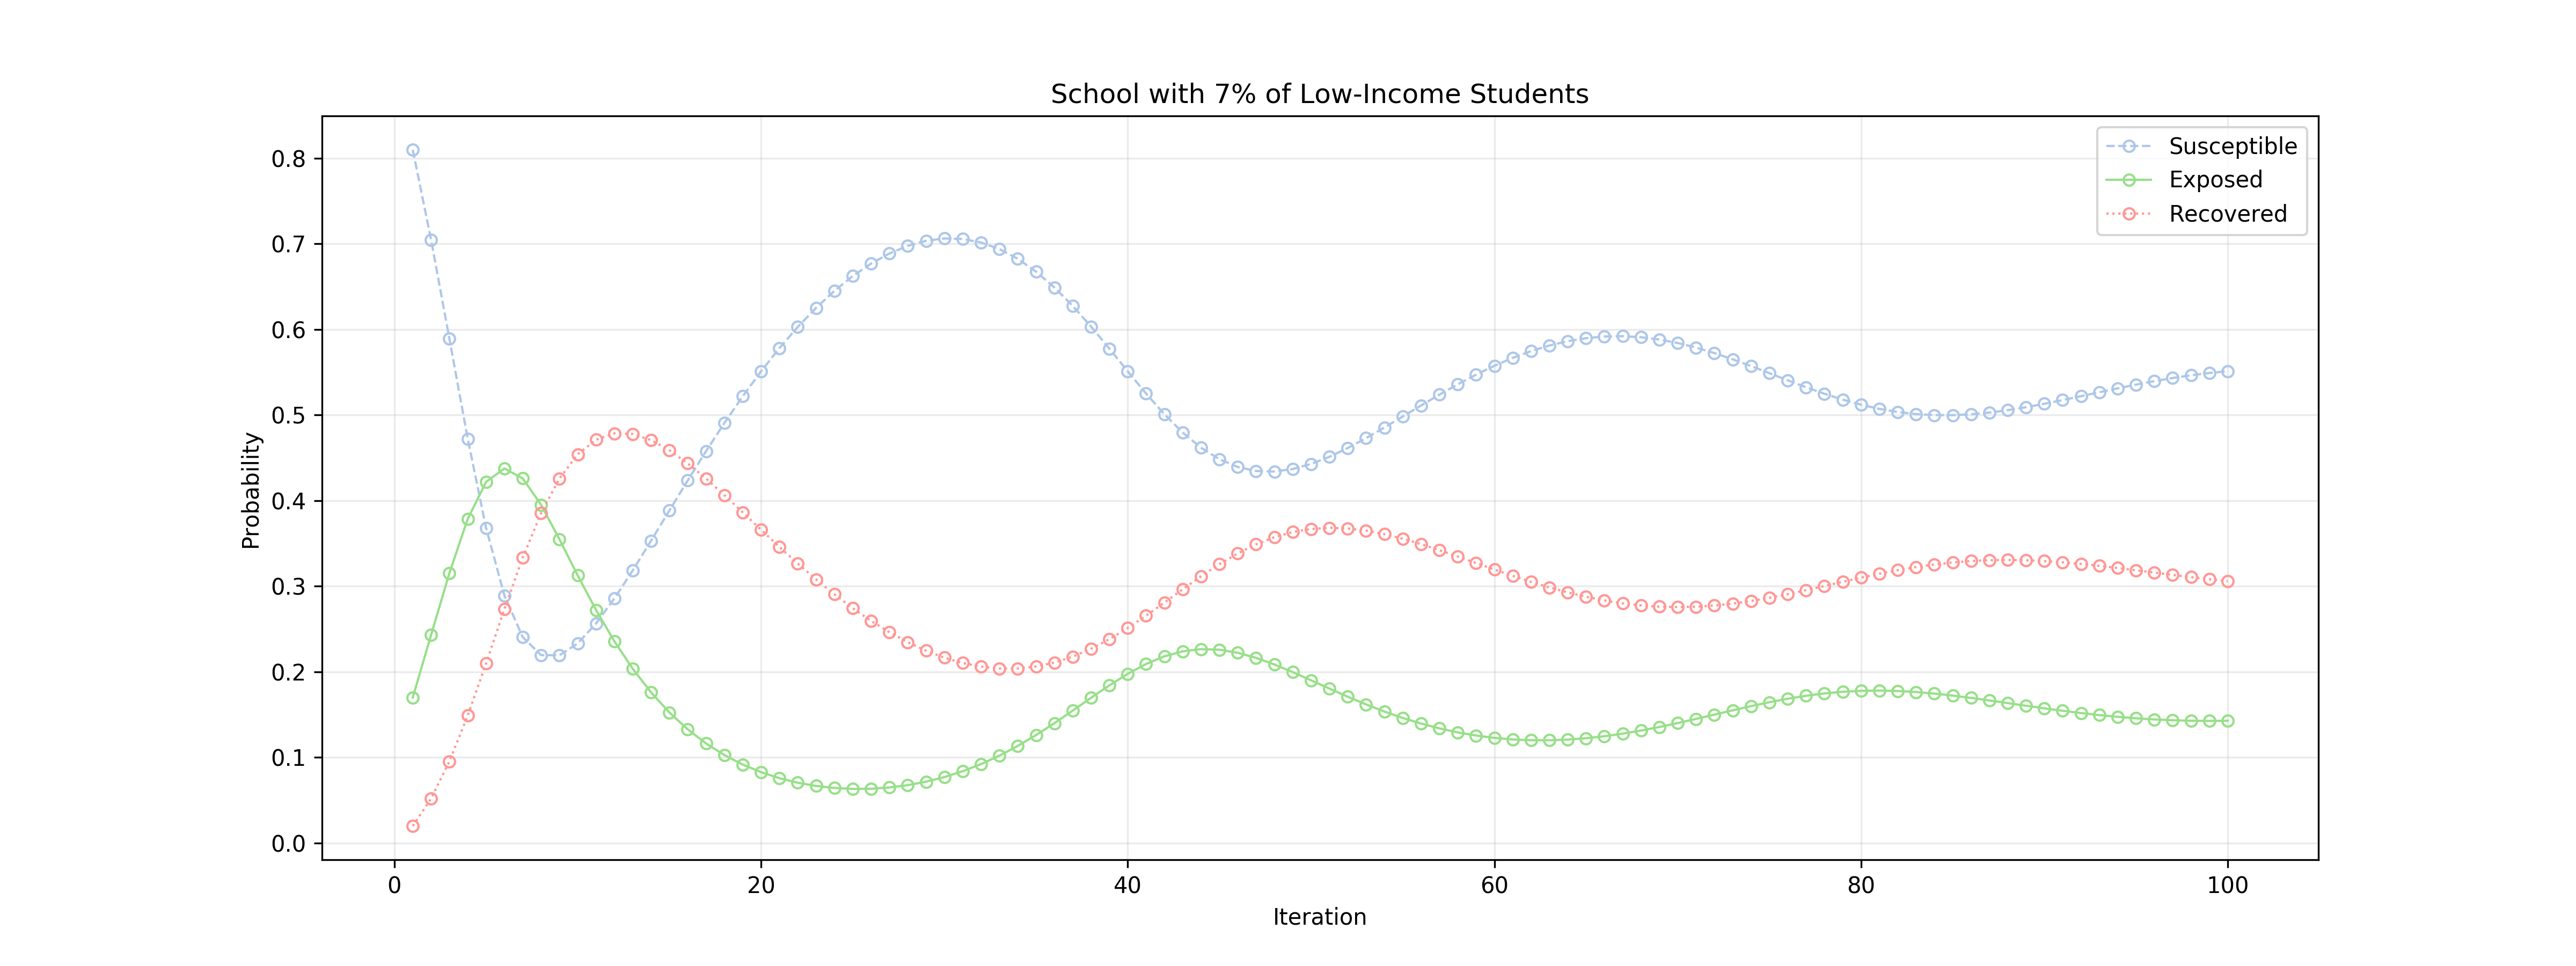
Medium-income school
The Two Schools Side-by-Side
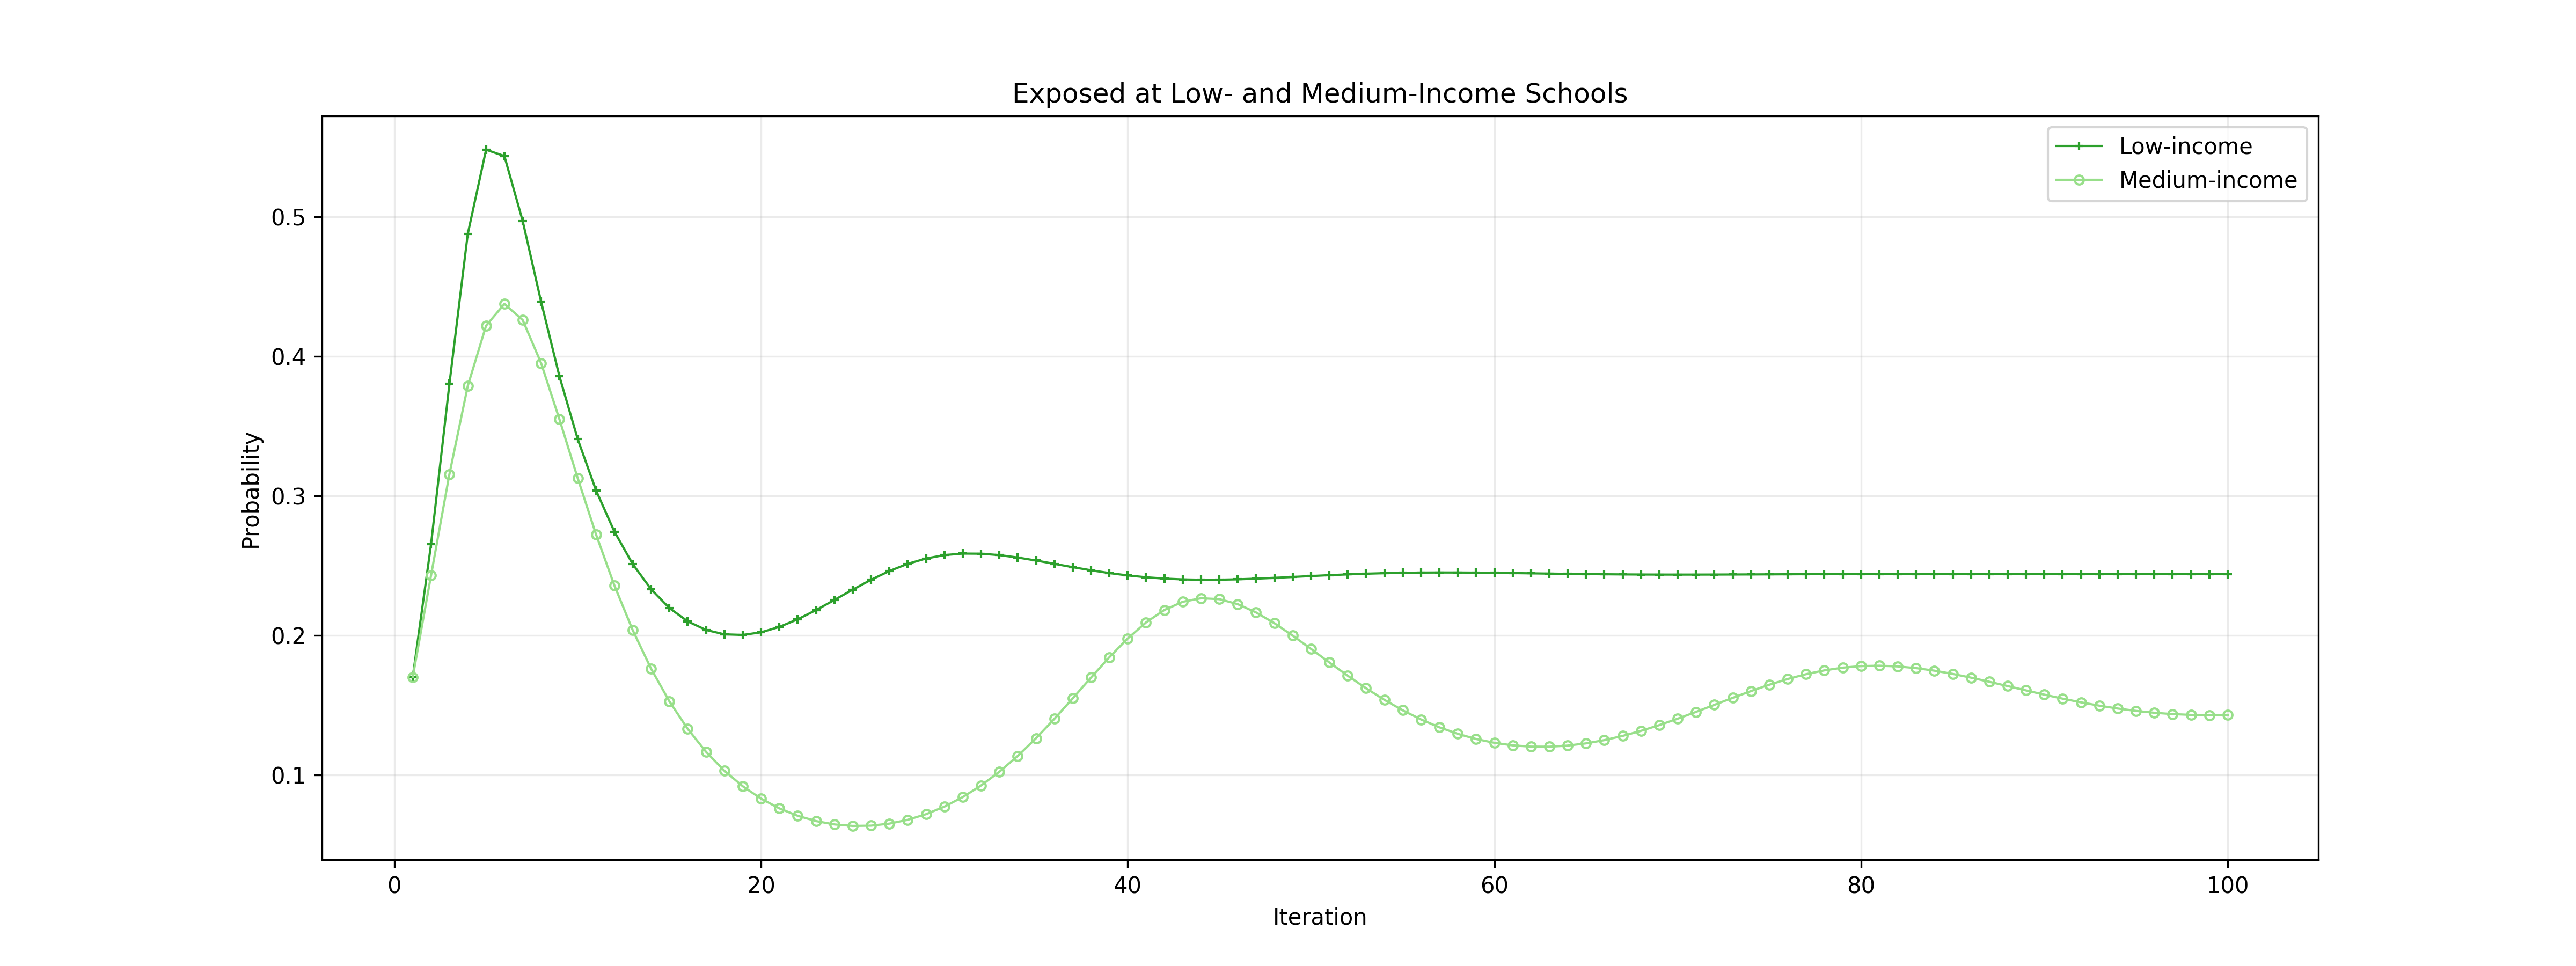
The plot below compares the low- and medium-income schools directly by plotting the probability of being exposed as a function of time. Evidently, students in the low-income school are at a higher risk of being exposed to the flu compared to their medium-income school counterparts. Consequently, an epidemic outbreak seems more likely at a low-income school. This is the sort of a result that may be difficult to predict but becomes clear via simulation. This is especially true for complex systems.
Another observation that is much easier to make using this side-by-side comparison is that the initial condition for both schools are identical (at least in terms of the flu status distribution) which suggests that the evident divergence is not due to the starting point.
Exposed at both schools
For completeness, below are the proportions of susceptible and recovered students at either site.

Susceptible at both schools
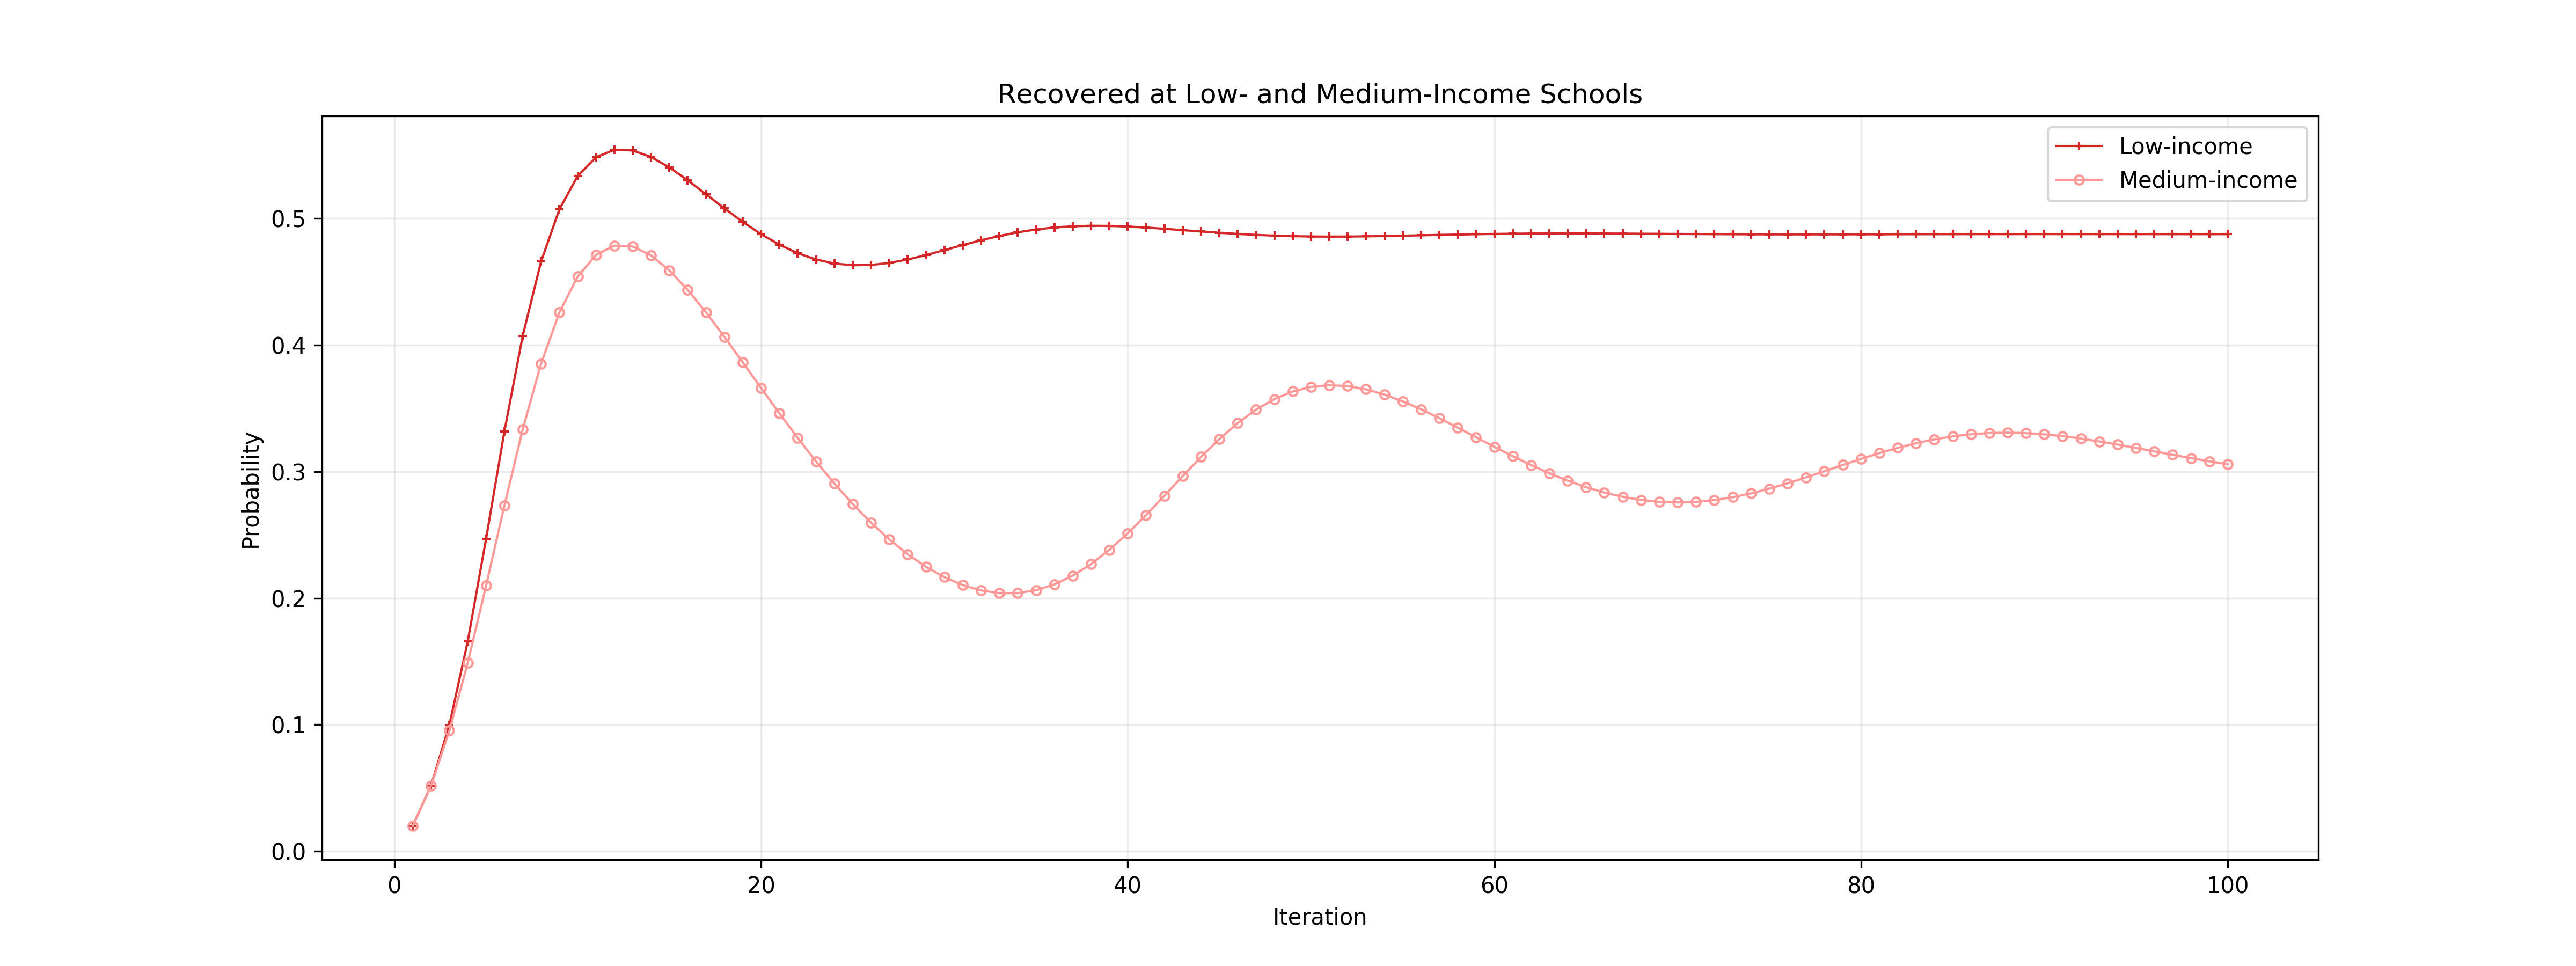
Recovered in both schools
The Simulation Output
Below is the output of the simulation when it is run synchronously from the terminal. For brevity, only five-iteration run is shown.
[info] Constructing a PRAM
[info] Running static rule analysis
[info]     Relevant attributes found : ['income', 'flu']
[info]     Relevant relations  found : ['school', 'home']
[info] Generating groups from a database (db/allegheny-students.sqlite3; table 'students')
[info]     Expected in table
[info]         Attributes : ['income', 'flu']
[info]         Relations  : ['school_id']
[info]     Found in table
[info]         Attributes : ['income']
[info]         Relations  : ['school_id']
[info]     Not found in table
[info]         Attributes : ['flu']
[info]         Relations  : []
[info]     Fixed manually
[info]         Attributes : {}
[info]         Relations  : {'home': Site(8217927942166902109)}
[info]     Final combination used for group forming
[info]         Attributes fixed      : {}
[info]         Attributes from table : ['income']
[info]         Relations  fixed      : {'home': Site(8217927942166902109)}
[info]         Relations  from table : ['school_id']
[info]     Generated 350 'school' sites from the 'schools' table
[info]     Summary
[info]         Records in table: 200,169
[info]         Groups formed: 696
[info]         Sites formed: 350
[info]         Agent population accounted for by the groups: 200,169
[info] Setting simulation duration
[info] Syncing rule timers
[info] Running group setup
[info] Running rule setup
[info] Compacting the model
[info] Capturing the initial state
[info] Initial population info
[info]     Agents : 200,169
[info]     Groups : 1,392
[info]     Sites  : 351
[info] Running the PRAM
[info] Iteration 1 of 5
[info]     Group count: 1392
[info]     Compacting the model
[info] Iteration 2 of 5
[info]     Group count: 3480
[info]     Compacting the model
[info] Iteration 3 of 5
[info]     Group count: 4176
[info]     Compacting the model
[info] Iteration 4 of 5
[info]     Group count: 4176
[info]     Compacting the model
[info] Iteration 5 of 5
[info]     Group count: 4176
[info]     Compacting the model
[info] Final population info
[info]     Groups: 4,176
[info] Running dynamic rule analysis
[info]     Accessed attributes    : ['income', 'flu']
[info]     Accessed relations     : ['school', 'home', '__at__']
[info]     Superfluous attributes : []
[info]     Superfluous relations  : []
[info] Running rule cleanup
[info] Compacting the model
[info] Finishing simulation